03 - Exploring Visualization
PyMove also has a visualization module to perform visual analysis on the data. These views make use of libraries like Matplotlib and Folium!
Hands-on!
1. Imports
import pymove as pm
from pymove.visualization import folium as f, matplotlib as mpl
from pymove.utils import visual
2. Load Data
move_df = pm.read_csv('geolife_sample.csv')
chunk1 = move_df[move_df['id'] == 1].head(5000)
chunk5 = move_df[move_df['id'] == 5].head(5000)
move_df = chunk1.append(chunk5)
move_df.head()
| lat | lon | datetime | id | |
|---|---|---|---|---|
| 0 | 39.984094 | 116.319236 | 2008-10-23 05:53:05 | 1 |
| 1 | 39.984198 | 116.319322 | 2008-10-23 05:53:06 | 1 |
| 2 | 39.984224 | 116.319402 | 2008-10-23 05:53:11 | 1 |
| 3 | 39.984211 | 116.319389 | 2008-10-23 05:53:16 | 1 |
| 4 | 39.984217 | 116.319422 | 2008-10-23 05:53:21 | 1 |
3. Exploring visualization module
a. Generate colors
We have a function that allows you to generate random colors so you can have more color options in your visualizations!
visual.generate_color()
'#00FF00'
Or passing intensity of each color will generate the color rgb
visual.rgb([0.6, 0.2, 0.2])
(51, 51, 153)
With this rbg tuple you can generate hex colors!
visual.hex_rgb([0.6, 0.2, 0.2])
'#333399'
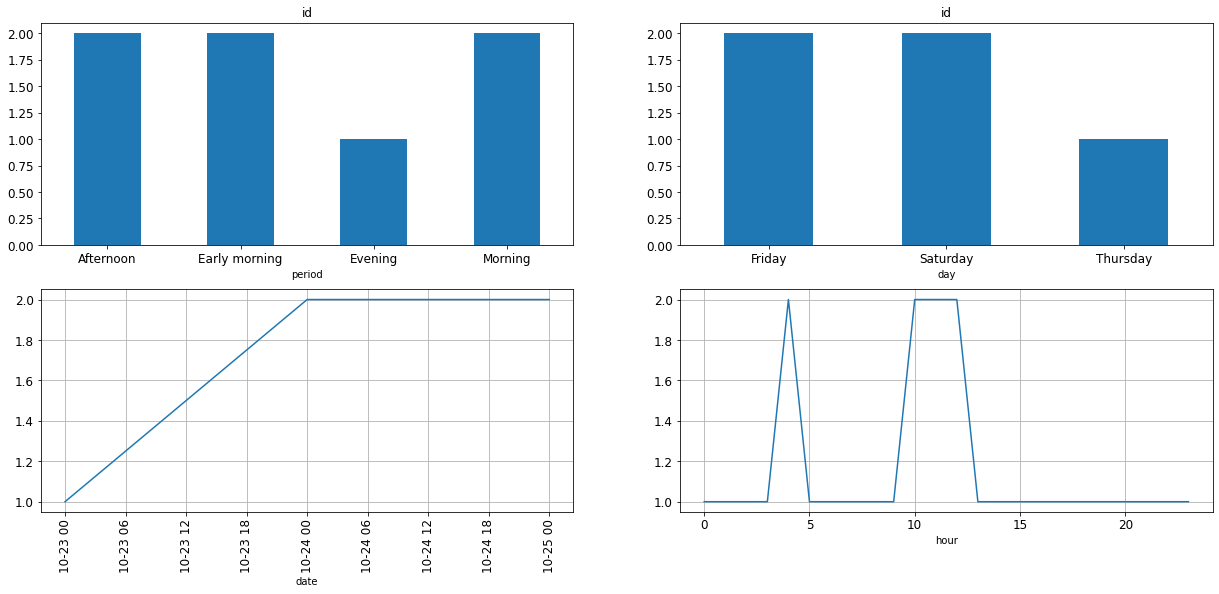
b. Exploring data over time
We can generate an overview that contains the distribution of data by time period, time, date, and day of the week to better understand how data is distributed.
mpl.show_object_id_by_date(move_df, return_fig=False)
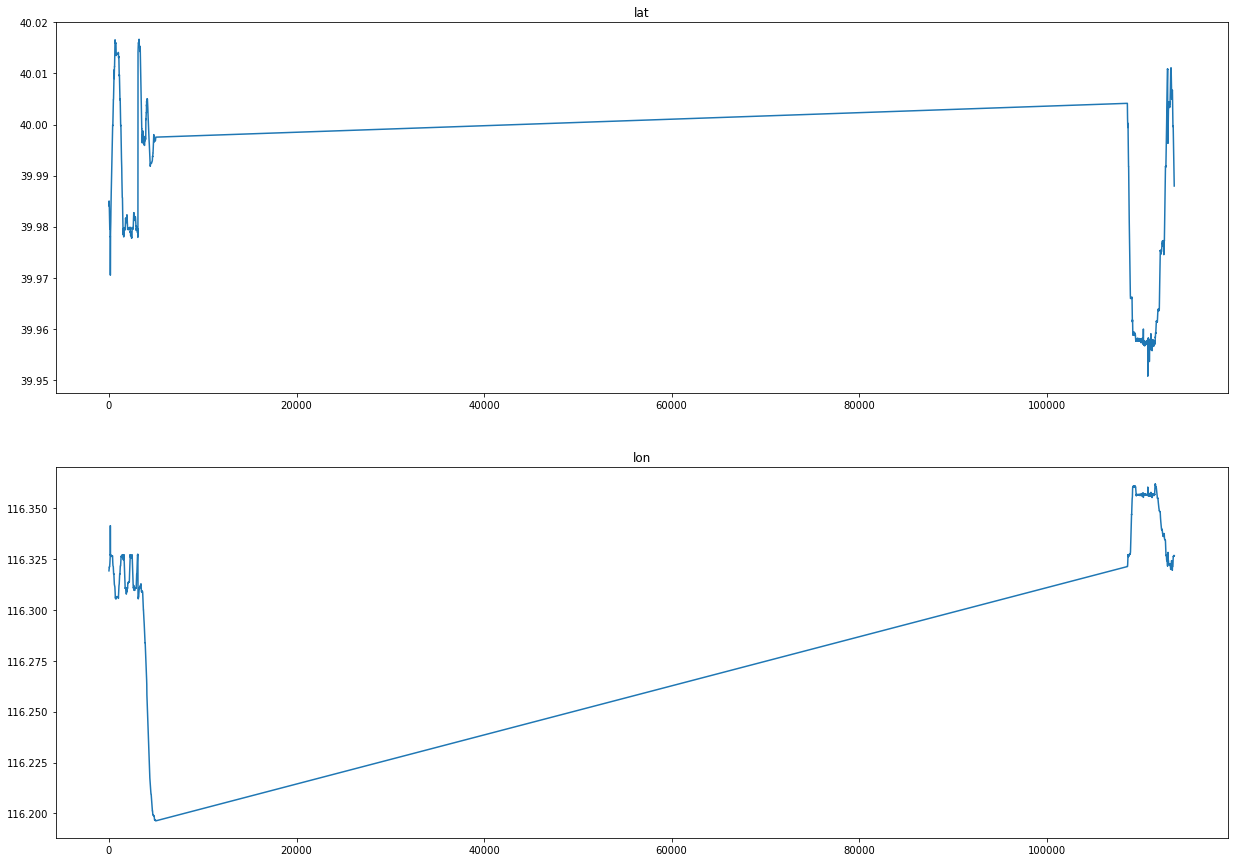
mpl.plot_all_features(move_df, return_fig=False)
We can generate a visualization of the trajectory points filtered by: - Day week
f.plot_trajectory_by_day_week(move_df, 'Saturday')
Make this Notebook Trusted to load map: File -> Trust Notebook
- Period of day
f.plot_trajectory_by_period(move_df, 'Morning')
Make this Notebook Trusted to load map: File -> Trust Notebook
- Period of time with start date and end date
f.plot_trajectory_by_date(move_df, '2008-10-23', '2008-10-23')
Make this Notebook Trusted to load map: File -> Trust Notebook
- Period of time with start and end time
f.plot_trajectory_by_hour(move_df, 1, 3)
Make this Notebook Trusted to load map: File -> Trust Notebook
c. Exploring trajectories
- Plot all trajectories
f.plot_trajectories(move_df)
Make this Notebook Trusted to load map: File -> Trust Notebook
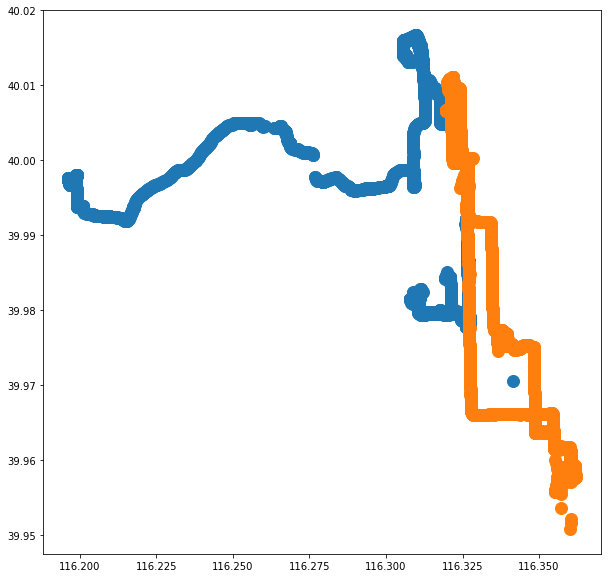
- Plot trajectory by id
f.plot_trajectory_by_id(move_df, 1, color="orange")
Make this Notebook Trusted to load map: File -> Trust Notebook
- Heat map
f.heatmap(move_df)
Make this Notebook Trusted to load map: File -> Trust Notebook
- Heat map with time
f.heatmap_with_time(move_df)
Make this Notebook Trusted to load map: File -> Trust Notebook
- Plot cluster
f.cluster(move_df, 1000)
Make this Notebook Trusted to load map: File -> Trust Notebook
- Faster MarkerCluster
f.faster_cluster(move_df)
Make this Notebook Trusted to load map: File -> Trust Notebook
- Plot stops points
move_df.generate_tid_based_on_id_datetime()
move_df.generate_move_and_stop_by_radius()
VBox(children=(HTML(value=''), IntProgress(value=0, max=2)))
mpl.plot_trajectory_by_id(move_df, id_="12008102305", label='tid', feature="situation", value="stop", return_fig=False)
f.plot_stops(move_df, n_rows=2000)
Make this Notebook Trusted to load map: File -> Trust Notebook
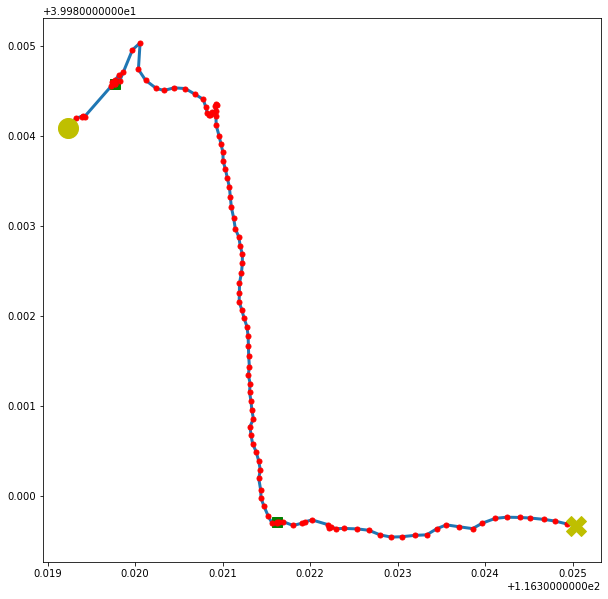
- Show lat and lon GPS
mpl.plot_trajectories(move_df, return_fig=False)
f.plot_markers(move_df, n_rows=400, zoom_start=13.5)
Make this Notebook Trusted to load map: File -> Trust Notebook